What is the highlight tool?
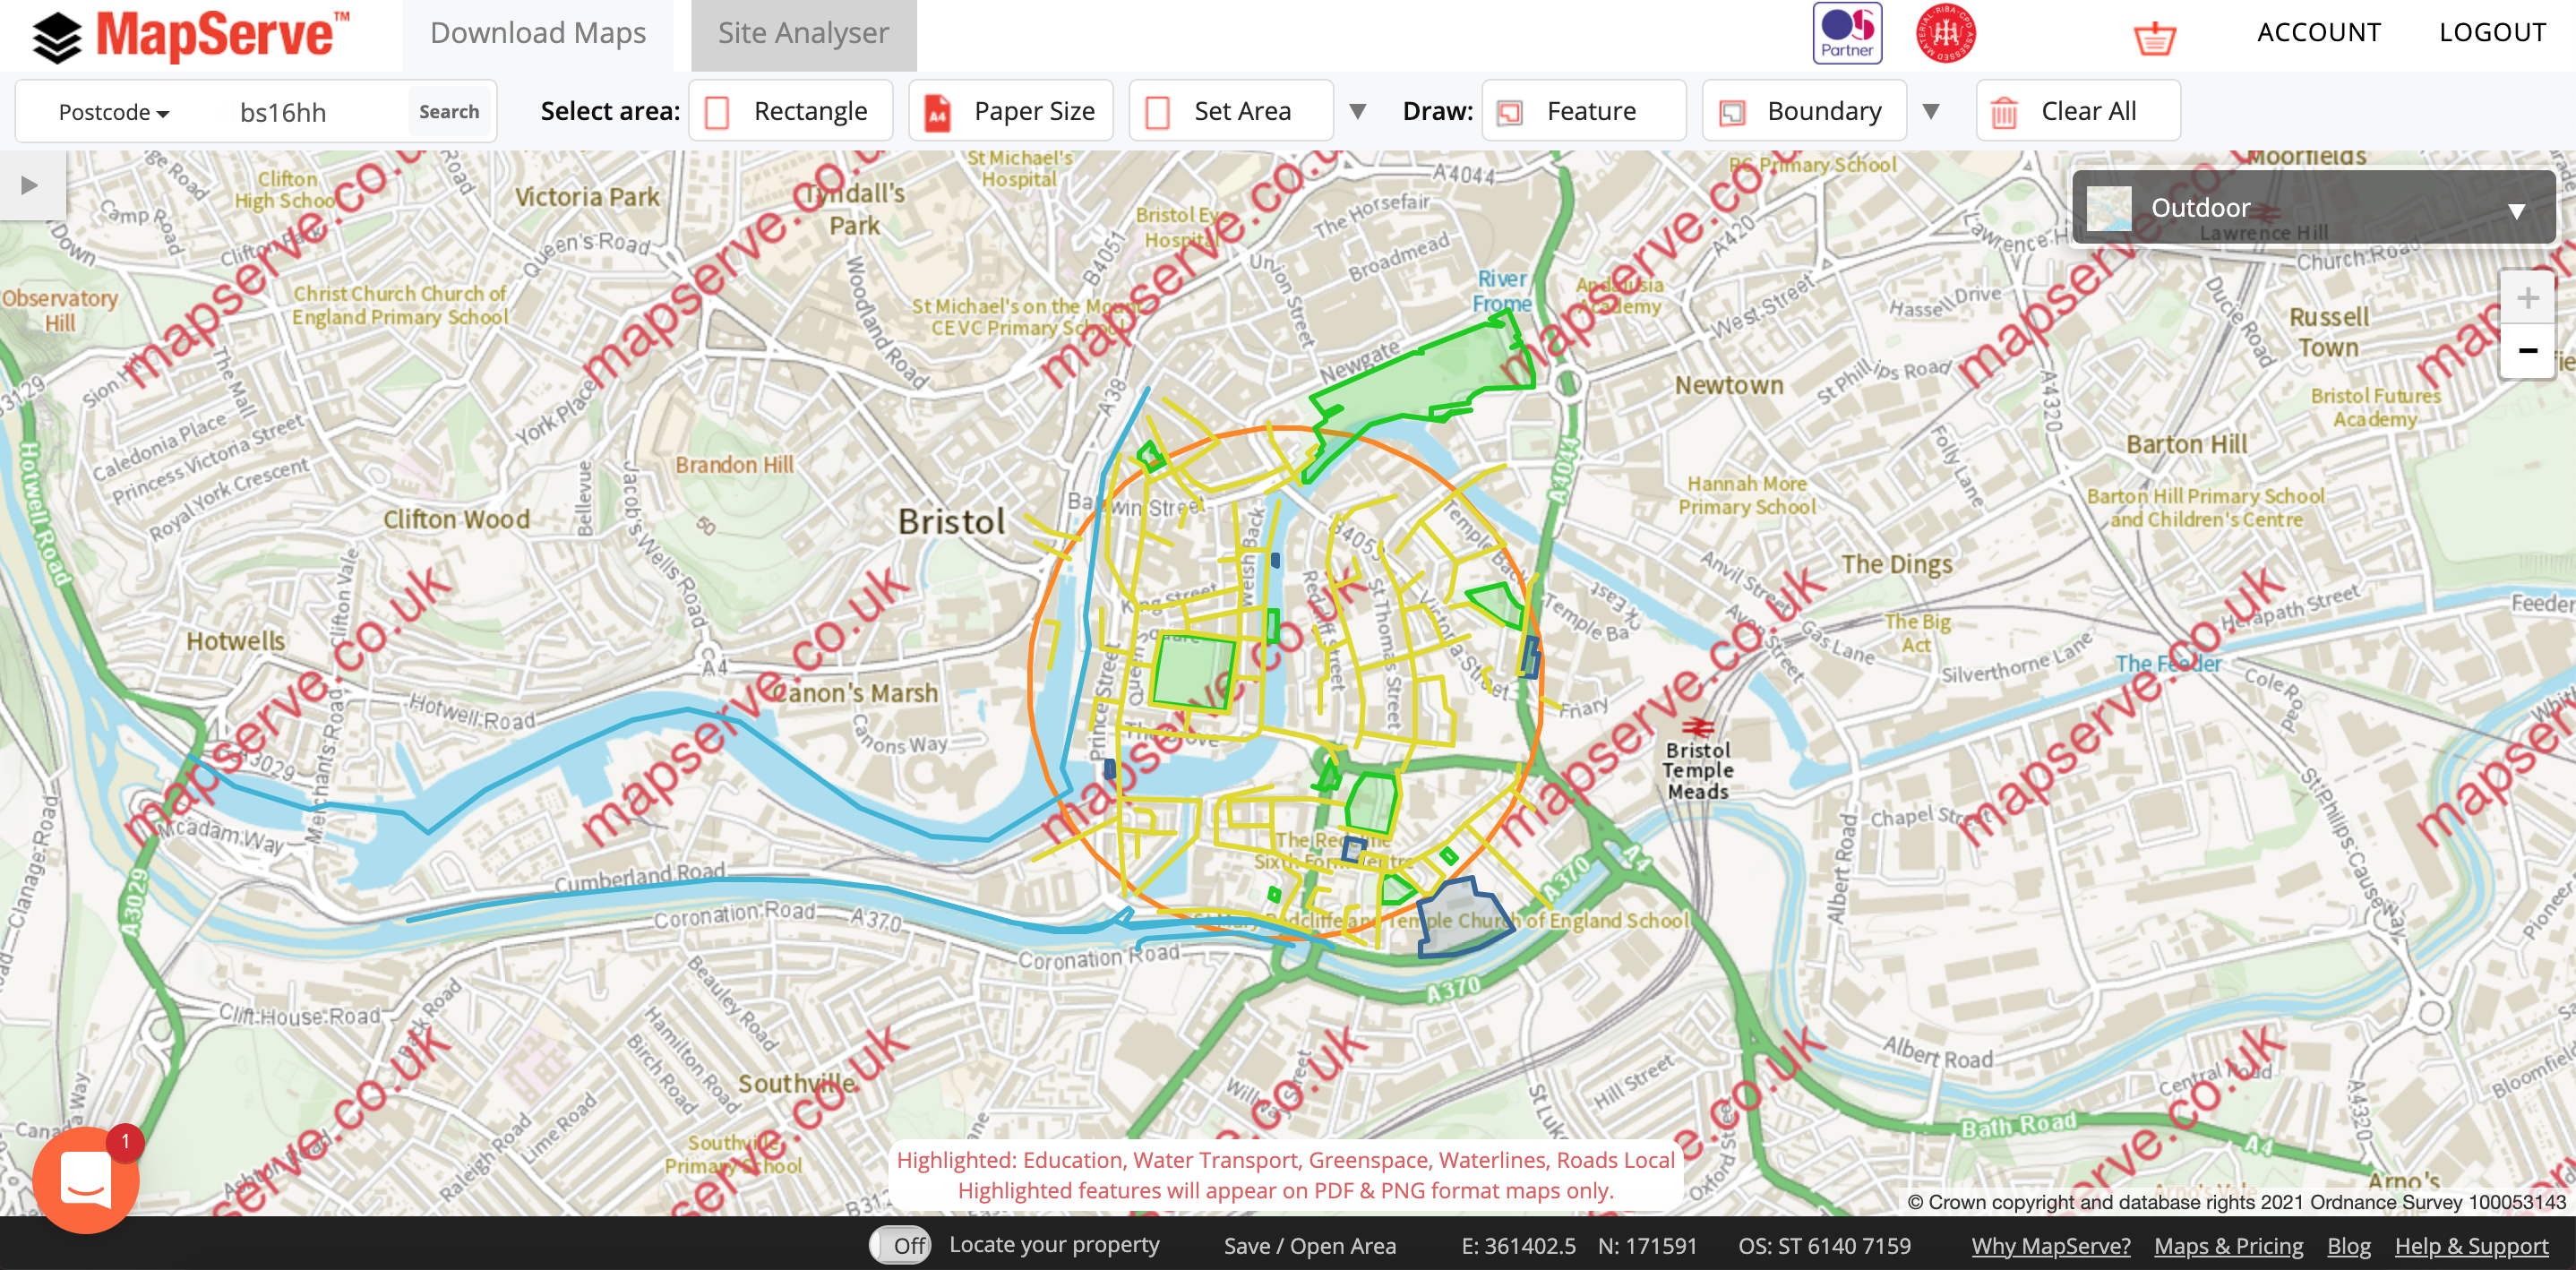
We have now launched our new tool called ''Highlight'', a feature designed for property professionals looking to analyse and explore a chosen area. It is now possible to view and research the water features, green spaces, urban growth and transport characteristics of a given site, and synthesise these analyses into visual information in the form of a PNG image.
Download your site analysis using our highlight tool here
Where is it?
The Highlight tool is situated on the top toolbar of MapServe®. You simply need to log in to your account and choose your area using the search engine. Then click on the grey arrow next to the Boundary tool to reveal the rest of the tools available on MapServe®.
How do I use it?
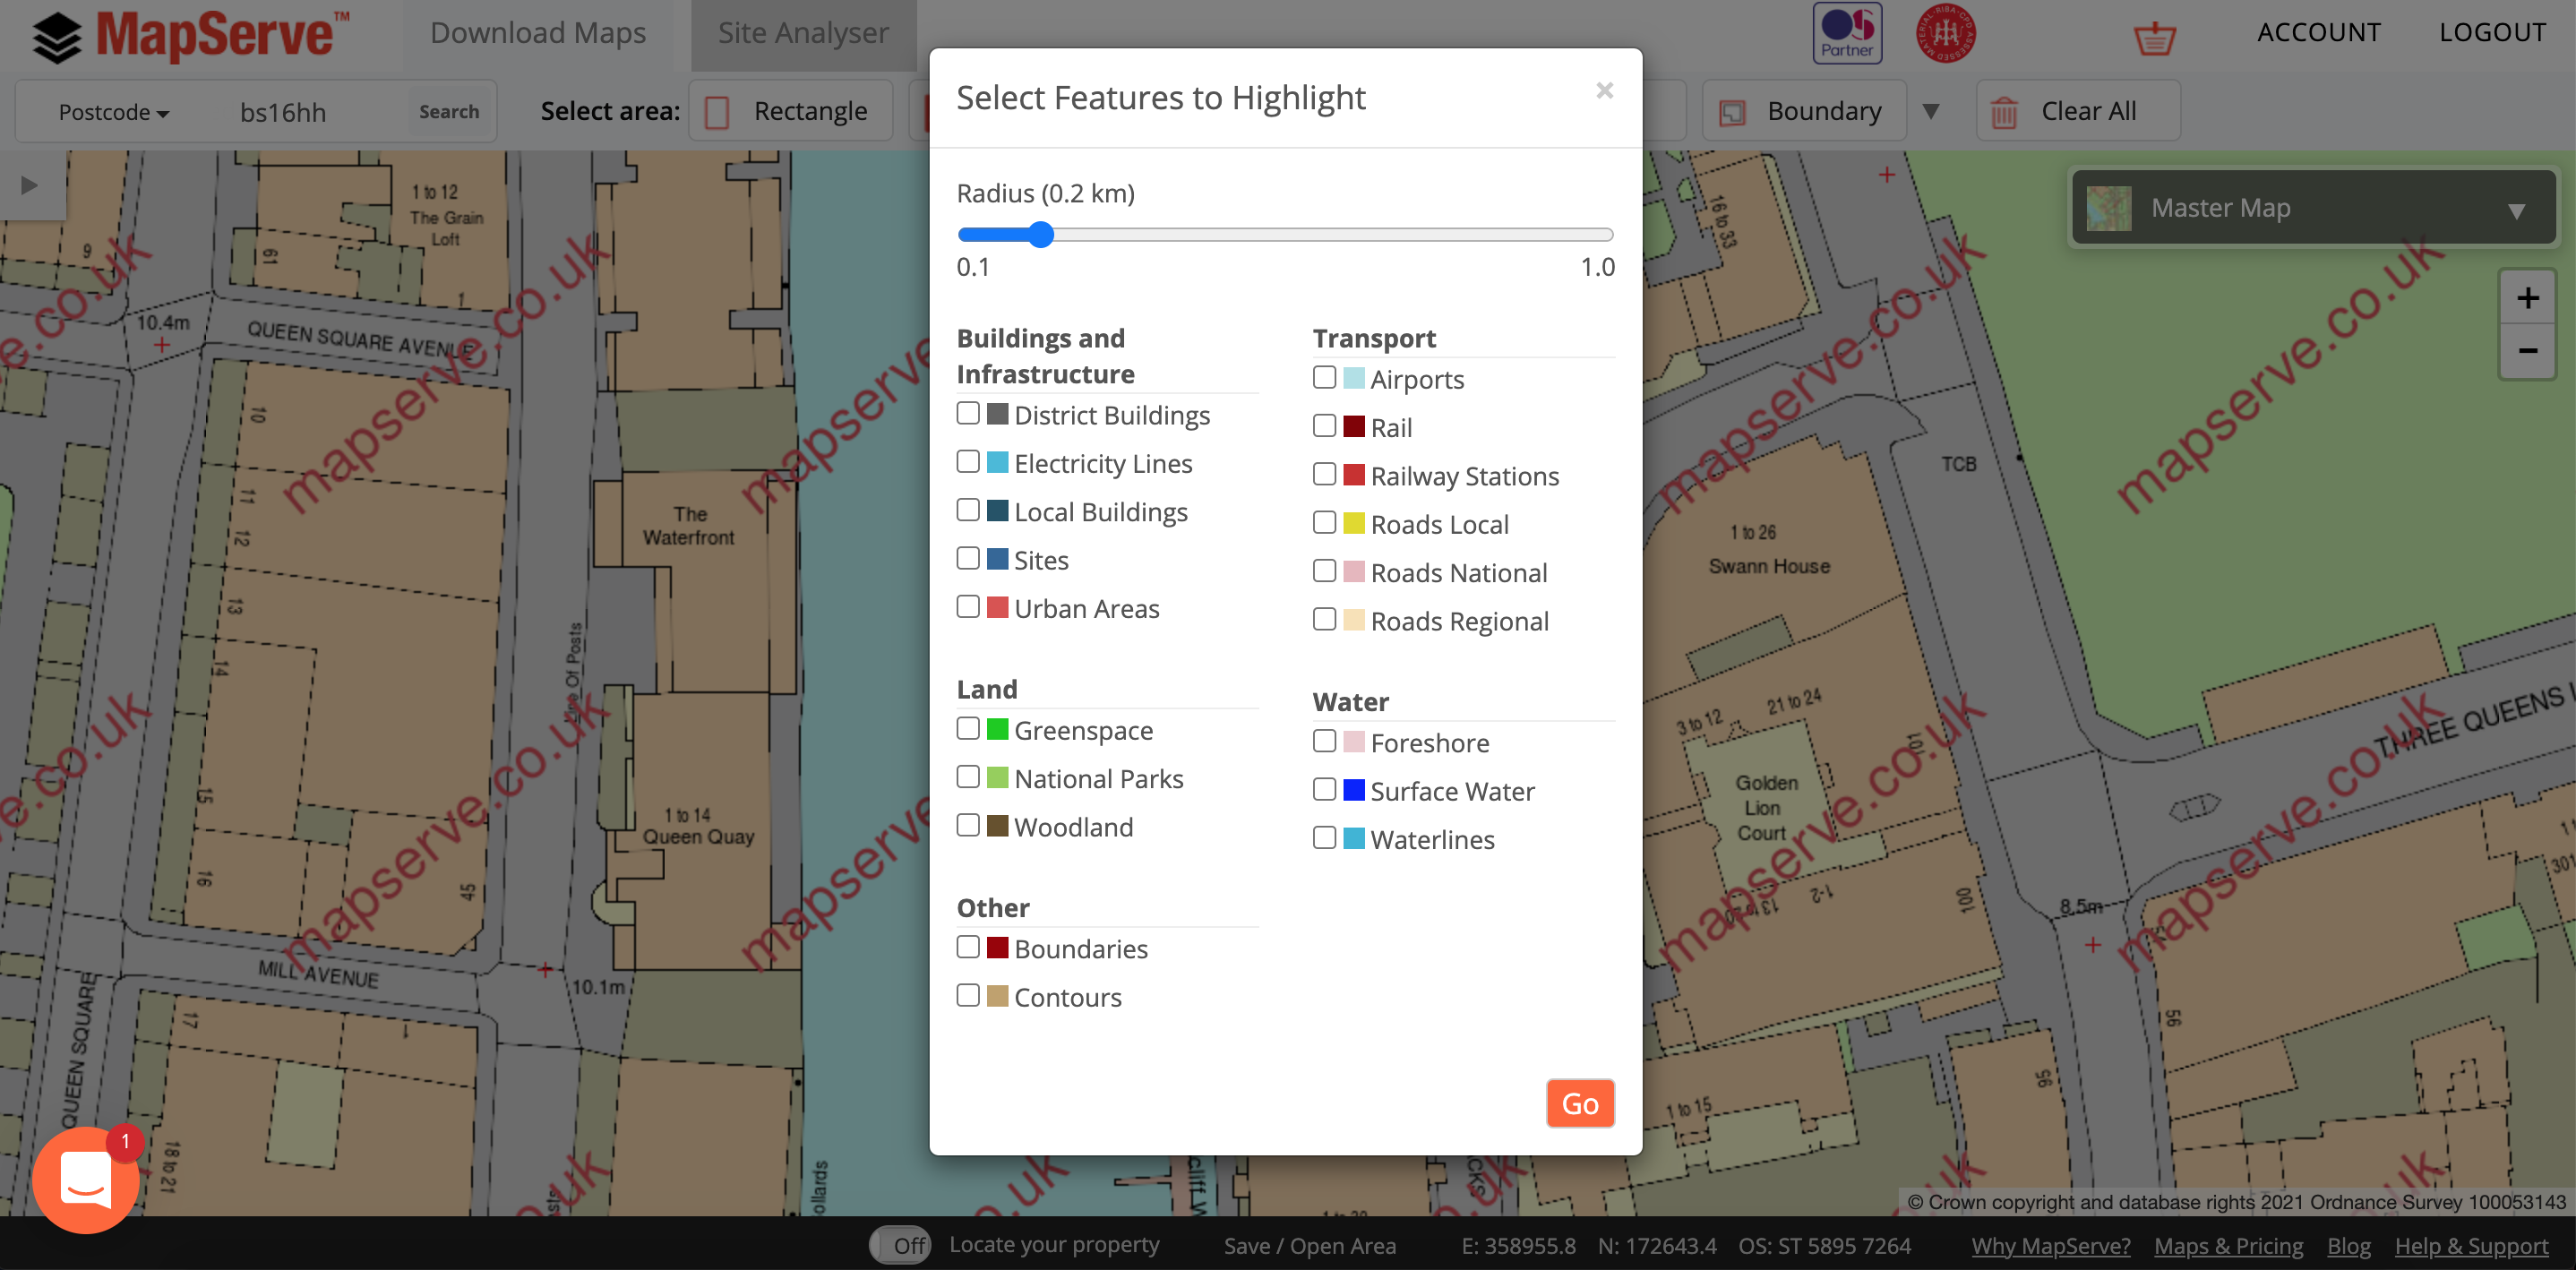
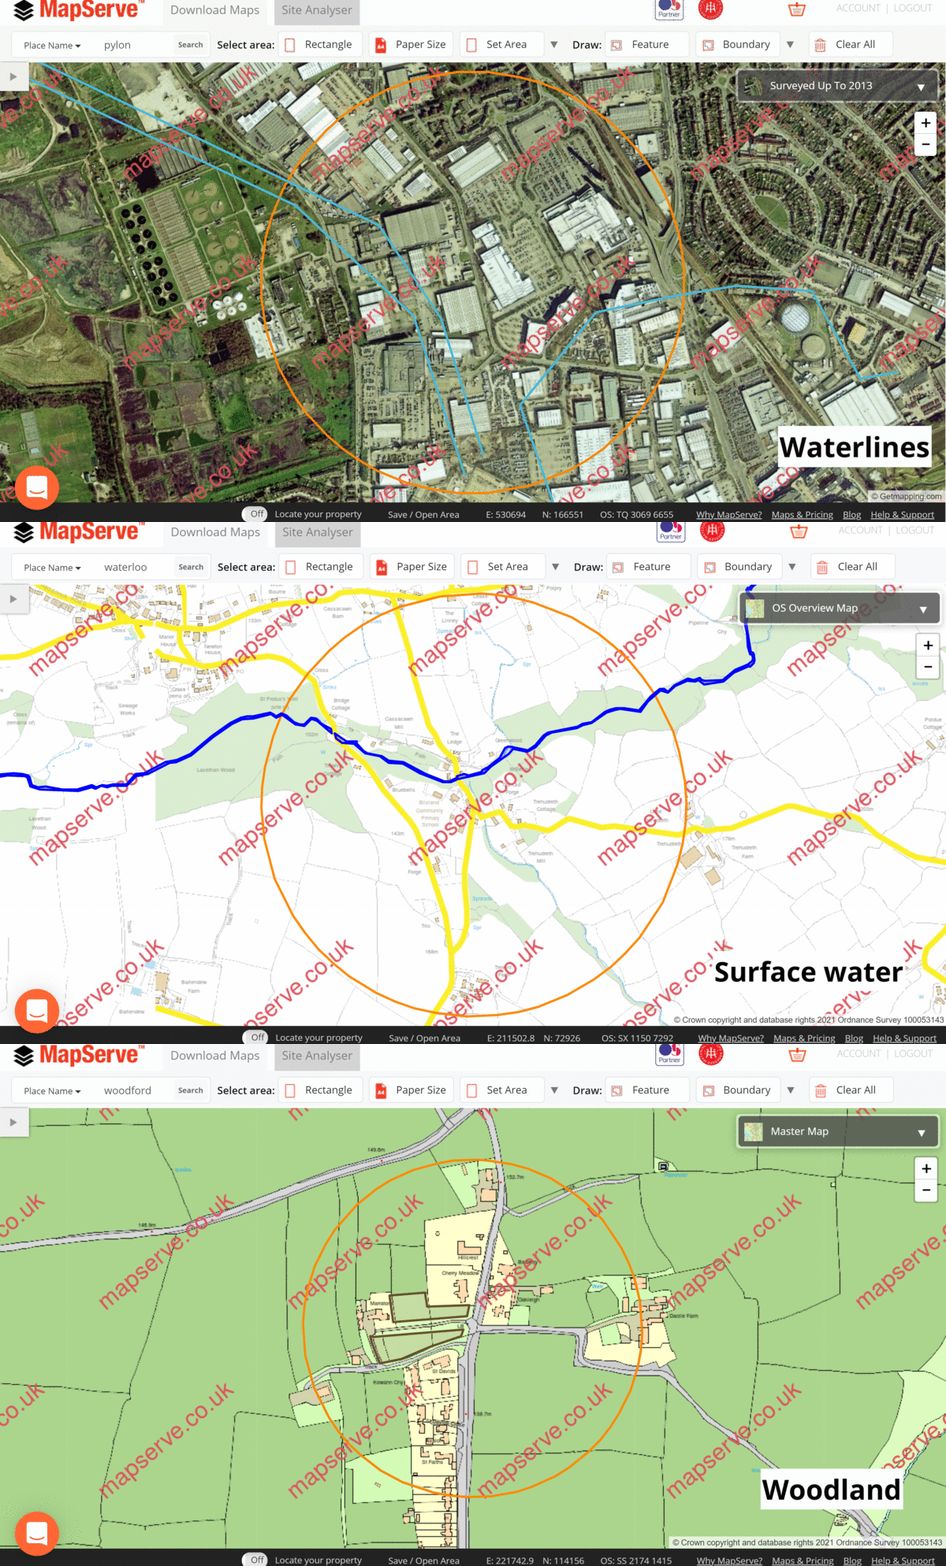
You can use the Highlight tool on OS MasterMap®, aerial photography, or the overview map depending on your project. Simply choose the radius you would like to cover around your property and click on the features that you would like to explore. You are able to view the file on MapServe® before exporting it in PNG format.
What does it include?
It includes multiple features including Buildings and Infrastructure, Transport links, Land and Water features.
For example, if you click on ''Sites'' (under the Buildings and Infrastructure category) it will highlight buildings that house:
- Education
- Medical Care
- Rail Transport
- Road Transport
- Water Transport
- Utility or industrial
Where can I use this tool?
- Design and Access Statement (DAS).
- As an initial site analysis.
- Show intro local context.
- Show that there are enough amenities to support a development proposal and use it to aid your case.
- Increase your chance of getting planning approval possibility of planning approval e.g. you can show that there is enough green space around the proposed area.


